By Claudine Raschi, MS · Last updated: September 2026
Quick Answer: How Do You Structure a Volume Rebate Ladder for Distributors?
Build a volume rebate tier structure with 3–4 thresholds anchored to each distributor’s trailing purchase baseline. Use incremental rates per tier, verify the top tier’s margin covers rebate cost, and publish terms equally to comply with Robinson-Patman.
What Is a Volume Rebate Ladder, and Why Does the Structure Matter?
A volume rebate ladder is a schedule of purchase thresholds, each paired with a rebate rate that rises as a distributor buys more. The volume rebate tier structure determines whether the program changes purchasing behavior or simply pays distributors for volume they were going to buy anyway.
Poorly calibrated tiers create two failure modes: thresholds too low pay full rebates for volume already delivered, and thresholds too high sit unreached. Both turn a volume rebate into a fixed cost. As Harvard Business Review’s research on pricing strategy makes explicit: a rebate should pay for outcomes the company wants to repeat; if it does not change behavior, it functions as an expense, not an incentive.
According to Level 6’s guide to volume incentive rebate programs, rebate income can represent 40%–70% of total net profit for many industrial distributors, which is why the design of the ladder — not just the headline rate — determines how much behavior actually changes. With 25+ years designing volume incentive rebate programs (VIR) for manufacturers, we’ve seen the same design errors repeat across industries — and the same fixes that resolve them.
Incremental vs. Retroactive Rebate Math
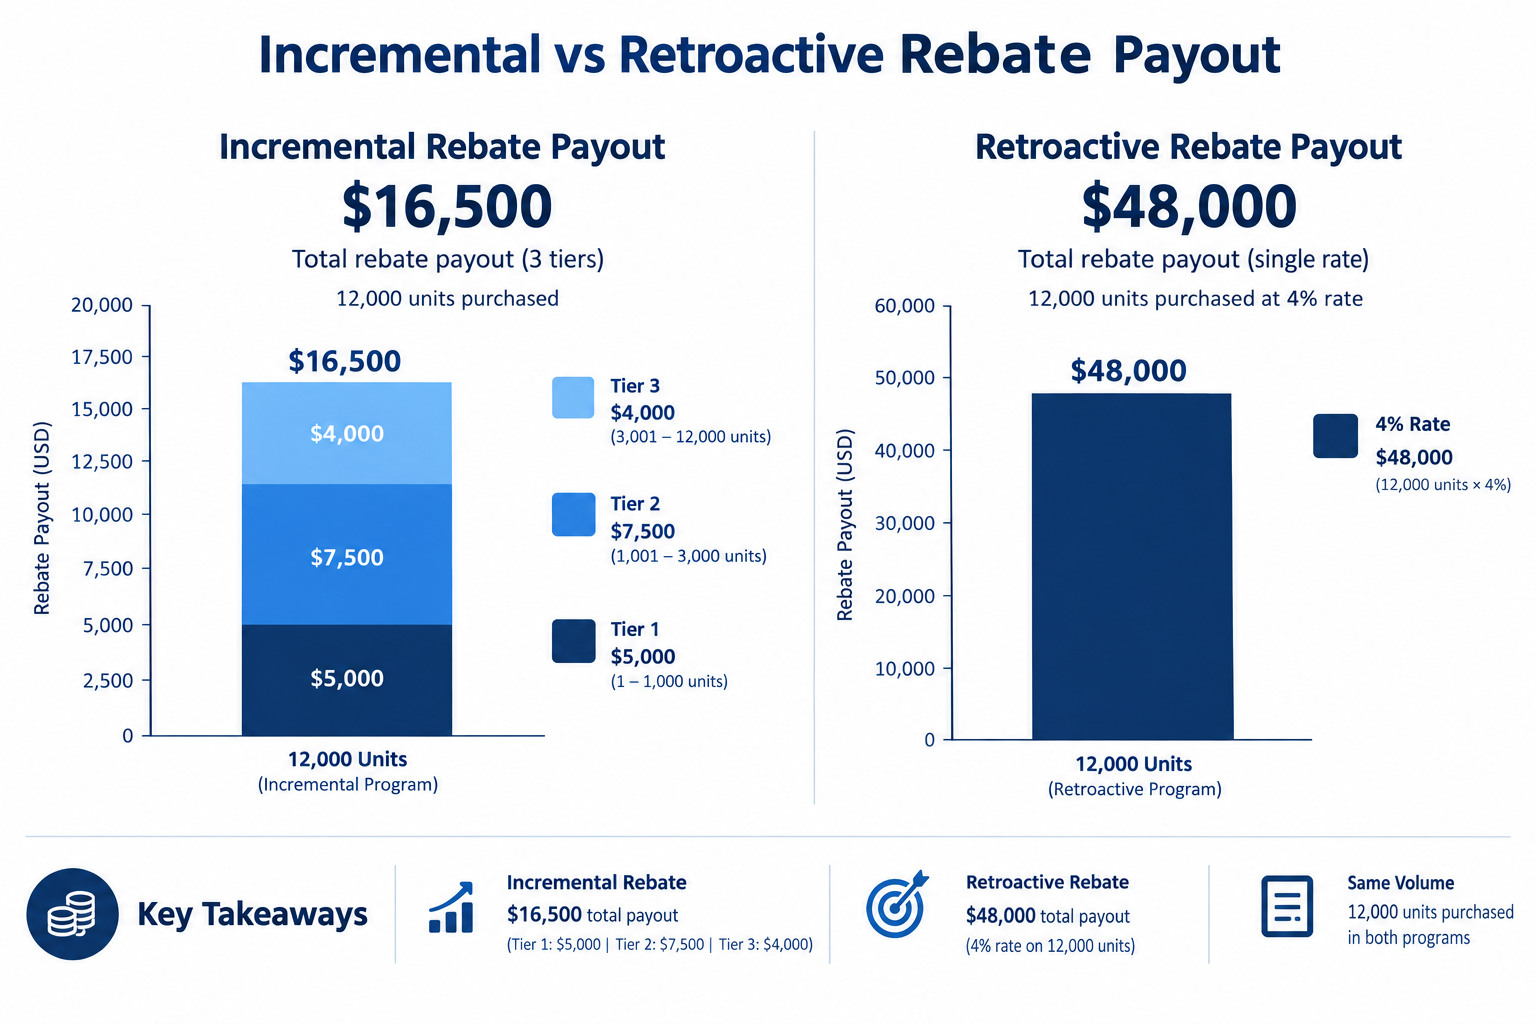
Incremental (marginal) volume rebate tiers — sometimes called slab-based rebates or marginal-rate ladders — apply each rate only to units purchased within that tier’s range, while retroactive tiers apply the single highest earned rate to the entire qualifying volume once a threshold is crossed. The two methods produce very different payouts on identical volume — choosing the wrong one is one of the most common and expensive rebate ladder design errors.
Worked Example: Incremental Tier Calculation
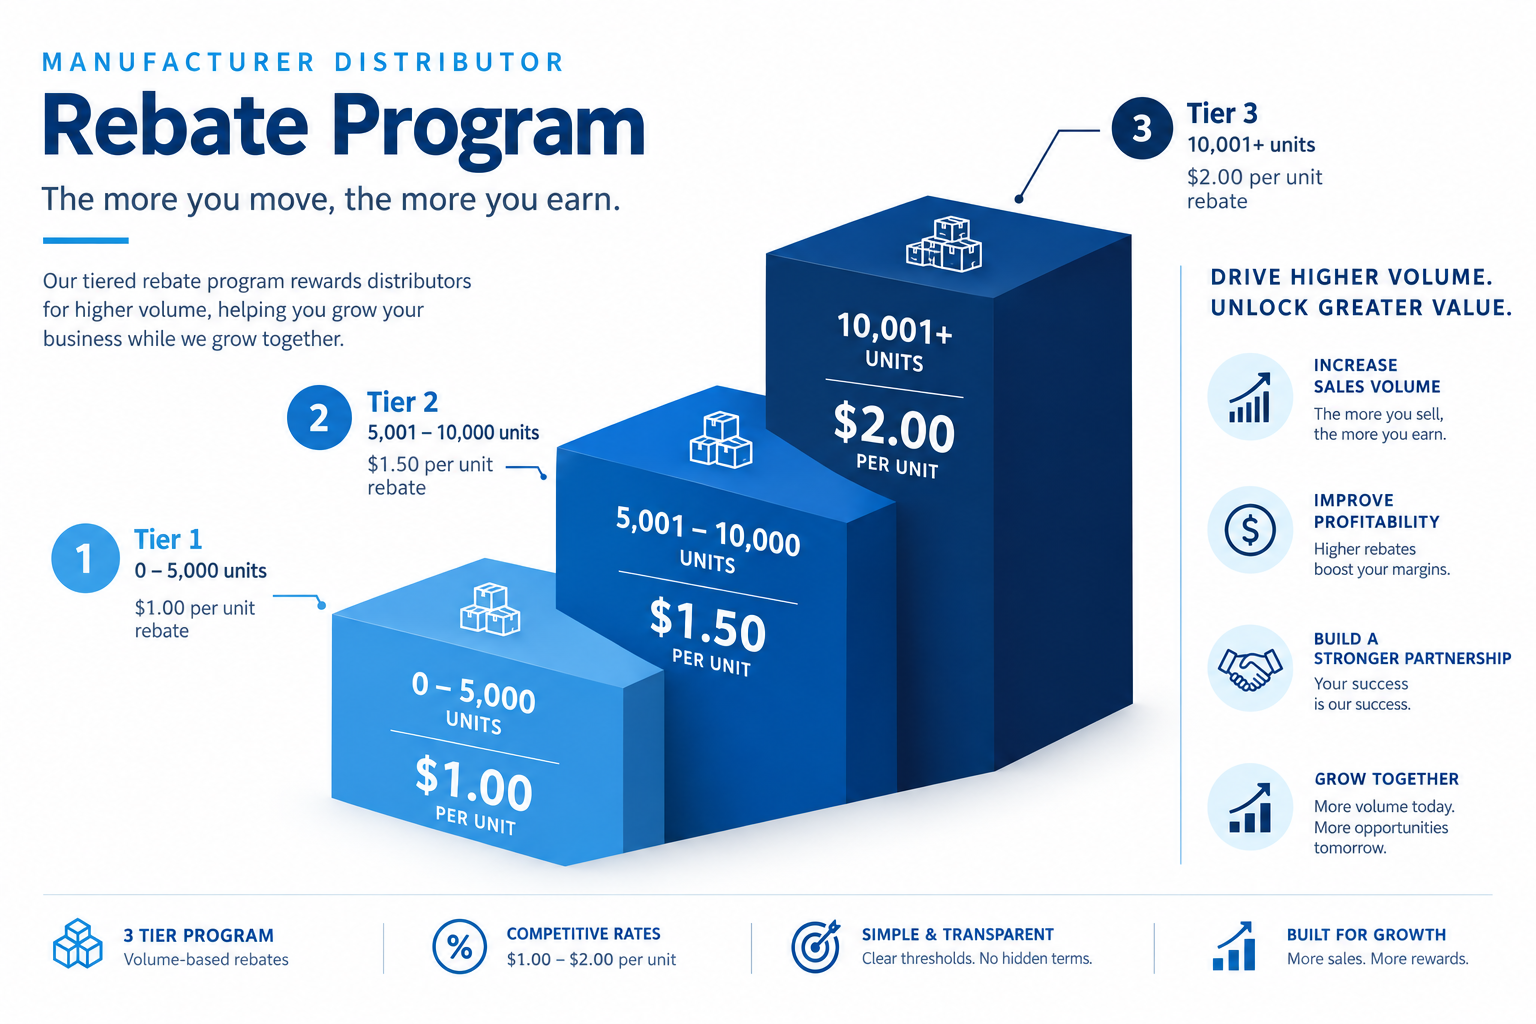
Consider a ladder with three tiers: Tier 1 pays $1.00 per unit for the first 5,000 units, Tier 2 pays $1.50 per unit for units 5,001–10,000, and Tier 3 pays $2.00 per unit for every unit above 10,000. A distributor purchasing 12,000 units earns rebate dollars calculated tier by tier, not as one blended rate applied to the full volume.
| Volume segment | Rate | Calculation | Rebate earned |
|---|---|---|---|
| First 5,000 units | $1.00/unit | 5,000 × $1.00 | $5,000 |
| Next 5,000 units (5,001–10,000) | $1.50/unit | 5,000 × $1.50 | $7,500 |
| Final 2,000 units (10,001–12,000) | $2.00/unit | 2,000 × $2.00 | $4,000 |
| Total | $5,000 + $7,500 + $4,000 | $16,500 |
The distributor earns $16,500 on 12,000 units — an effective blended rate of roughly $1.375 per unit. This incremental design is the standard approach for a tiered rebate structure because it pays for each unit at the rate that unit actually earned, containing manufacturer liability as thresholds are crossed, as Level 6 walks through in its volume incentive rebate program guide.
Worked Example: Retroactive Tier Calculation
Retroactive rebates re-rate all qualifying purchases at the highest tier the distributor reached. A supplier offering 2% on 0–10,000 units and 4% on 10,001-plus units who ships 12,000 units at an average price of $100 each owes 12,000 × $100 × 4% — a $48,000 rebate on the full volume, not just on the units above 10,000.
That single-unit crossing effectively adds roughly $24,000 versus what an incremental structure would pay on the same volume. Retroactive volume rebate tier structures reward the distributor far more generously per unit and carry materially higher, harder-to-forecast liability. A late-quarter surge can retroactively swing thousands of dollars in liability with little warning, which is why retroactive ladders demand tighter accrual discipline throughout the period, as Level 6’s distributor rebate accrual guide details.
Choosing Between the Two Methods
Incremental structures cost less at the margin, avoid abrupt payout jumps, and are easier to model for finance. Retroactive structures are simpler to explain to a purchasing team — one rate, applied to everything — but expose the manufacturer to larger, harder-to-forecast payouts. For a first-time volume rebate tier structure, incremental is almost always the more conservative and defensible starting point.
The End-of-Period Cliff Risk in Retroactive Ladders
Retroactive volume rebate tier structures with hard thresholds create a forfeit-all cliff: a distributor who misses a tier boundary by even a single unit earns the lower rate on their entire volume. A distributor sitting at 9,998 units with two units left to go earns 2% on everything; one who reaches 10,000 earns 4% on everything — a payout difference that can exceed the value of those final two units by orders of magnitude.
This cliff dynamic distorts distributor purchasing behavior at period-end — some rush orders to cross a boundary, others place nothing once a tier is out of reach. Manufacturers using retroactive ladders should consider adding an accelerator or catch-up window in the final 30 days, or switching to incremental tiers, so distributors near but below a boundary still have a reason to keep buying.

How to Set Tier Thresholds from Distributor Baseline Data
Volume rebate tier thresholds should be anchored to each distributor’s trailing 12-month purchase baseline, not to a manufacturer’s internal sales-target arithmetic. A threshold no current partner can realistically reach produces no behavioral change, while a threshold everyone already clears simply adds cost without driving incrementality.
A practical calibration range is 110%–130% of a distributor’s prior-year volume for the first tier above baseline. This keeps the rebate ladder ambitious without asking for an unrealistic leap. Each tier boundary should sit where there is real distributor density just below it. If ten distributors cluster at 4,200–4,800 units, a 5,000-unit threshold creates a visible, reachable stretch goal for that cohort. Setting the threshold at 8,000 units strands that segment with no near-term path to the next rate.
Quarterly vs. Annual Measurement Periods
The measurement period is one of the most consequential structural choices in volume rebate tier structure design. Annual programs give distributors a full year to build volume and recover from slow quarters, which typically produces higher total rebate redemption. Quarterly programs create four accountability windows per year, which can drive stronger mid-period purchasing urgency but risk leaving distributors stranded after a weak Q1 with no path to meaningful rebate income for the rest of the year.
Most manufacturers in capital-equipment and industrial distribution use annual periods, because distributor purchasing cycles often span multiple months and quarterly cutoffs can create unnatural order-timing behavior. Consumer-goods and FMCG manufacturers more commonly use quarterly periods, where replenishment cycles are short enough for distributors to genuinely manage toward a quarter-end threshold. Whatever period you choose, the accrual and reporting cadence should match — quarterly measurement paired with only annual accrual review creates the same forecasting blind spots as an untested retroactive tier structure.
Segmenting by Distributor Size
Large, mid-size, and small distributors rarely belong on the same ladder. Segmenting thresholds — while keeping rate progression consistent — lets a regional distributor and a national account both have an attainable next tier. A single ladder that only rewards the largest accounts will leave the middle of the distribution network unaffected, and that middle is usually where the most incremental volume opportunity sits.
In practice, most manufacturer volume rebate programs segment distributors into two to four purchasing bands before setting thresholds. McKinsey research on distributor pricing found that the largest 20% of distributor accounts often generate 60–70% of rebate payout but only 30–40% of incremental volume — precisely because their baseline purchasing is already high and a single ladder rarely stretches them meaningfully beyond what they would have bought anyway.
Most effective ladders use three to four tiers total per segment. Fewer is too blunt to reward real differences; more than four becomes hard for distributor purchasing teams to track and adds administrative overhead without a proportional lift in behavior, according to McKinsey & Company research on distributor pricing.
Volume Rebates vs. Growth Rebates: Which Structure Fits?
Not all volume rebate tier structures measure the same thing. Absolute-volume rebates reward reaching a fixed purchase threshold regardless of prior-year baseline — a distributor buying 10,000 units earns the same rate whether they bought 9,000 or 3,000 units last year. Growth rebates, by contrast, set thresholds as a percentage increase over each distributor’s individual baseline, so the incentive specifically rewards incremental purchases above what that distributor was already doing.
Growth-based tiered rebate programs are more complex to administer but better isolate the incremental behavior the manufacturer is paying for. A large distributor already buying 50,000 units earns nothing from an absolute-volume program that tops out at 25,000 — but would respond to a growth rebate offering 2% for a 10% increase and 4% for 20%. The best structure depends on whether the manufacturer’s goal is rewarding total purchase scale or buying genuine volume shifts from each specific account.
Worked Case: A National HVAC Distributor Network
Before a recent volume rebate tier structure redesign, a national HVAC distributor’s manufacturer had set a single flat 20,000-unit entry threshold — based on a sales target, not purchase history. Pulling two years of actual purchase data showed most regional distributors were buying 6,000–9,000 units per period, nowhere near that entry point.
Redesigning around the real baseline meant setting Tier 1 at 5,000 units, Tier 2 at 10,000, and Tier 3 at 18,000, so the majority of distributors started the next period within visible striking distance of a tier boundary. The manufacturer could also forecast payout exposure tier by tier, because each boundary had a known cohort of accounts approaching it.
How to Calculate the Breakeven Point for a Rebate Tier
Before adding or raising a tier, run a breakeven test: the incremental volume the tier drives, multiplied by gross margin after the rebate rate, must exceed the rebate cost paid on volume the distributor would have purchased without the program. If the math doesn’t clear, the tier is a cost dressed as an incentive.
Take a manufacturer considering a new top tier paying 3% once a distributor crosses 25,000 units, on a product line carrying 40% gross margin. Applying the breakeven formula — (rebate rate × tier floor) ÷ (gross margin % − rebate rate %) — gives (0.03 × 25,000) ÷ (0.40 − 0.03) = 750 ÷ 0.37 ≈ 2,027 incremental units needed before that tier pays for itself.
If a distributor at that tier boundary was already going to buy 24,000 units regardless, the rebate paid on those 24,000 units is a margin giveaway. Only the units purchased because of the ladder — the ones that crossed that 2,027-unit gap — are truly funded by new profit. This is the same margin trap Level 6 documents in its analysis of rebates versus upfront B2B discounts: a program that only rewards existing purchasing habits reduces realized price without buying any new behavior.
Robinson-Patman Compliance and Tier Design
Under the Robinson-Patman Act, a manufacturer’s volume rebate tier structure must be offered on proportionally equal terms to all competing distributors at the same functional level — favoritism toward one account over a directly competing one is the core risk the statute targets. Standard, published quantity-based tiers generally satisfy this when every eligible distributor can access the same thresholds and rates.
The Federal Trade Commission’s Robinson-Patman Act annual update notes that standard quantity discounts don’t create a price-discrimination claim if functionally available to all customers — but there is no automatic safe harbor simply because a rebate is volume-based. A rebate is not considered “available” to a competing distributor who was never told the offer existed, even if the terms were technically open to them. Documenting how each tier was communicated is part of defensible ladder design.
Separately, for tax treatment, manufacturer-to-distributor rebates tied to purchase volume are generally treated as reductions in the cost of inventory purchased rather than separate income, provided the distributor is not obligated to perform marketing or other services in exchange, per IRS guidance on volume-related trade discounts. Keeping the rebate agreement free of service obligations — no advertising commitments, no joint marketing deliverables — keeps this treatment clean. None of this replaces legal review of a specific program before launch.
Accrual, Governance, and Ongoing Program Review
A volume rebate tier structure is a financial liability from the moment qualifying purchases begin, not when the check is cut. Under ASC 606 and ASC 808, manufacturers must estimate variable consideration — including rebates — at the transaction level using the expected-value or most-likely-amount method, and record the constraint as a reduction of revenue rather than as a selling expense.
In practice, this means estimating and recording the rebate obligation as sales occur throughout the period, using a probability-weighted tier estimate based on each distributor’s purchase trajectory rather than defaulting to the maximum tier rate for everyone.
Accruing at maximum tier across the board consistently overstates liability. A mid-market manufacturer that made this mistake ended up with a year-end rebate liability roughly 60% higher than what was actually earned — producing a fourth-quarter revenue correction that distorted pricing decisions for two subsequent quarters. Moving to monthly reassessment against real purchase trajectories, as Level 6’s distributor rebate accrual accounting guide outlines, keeps the accrual accurate and avoids period-end surprises.
Beyond accrual, the ladder itself needs a defined annual refresh. Thresholds calibrated from purchase history three years ago will systematically overpay some distributors and underpay others as buying patterns shift.
Manufacturers running a rebate ladder alongside other discount programs also need explicit stacking rules — which programs can combine, and up to what total cap — to prevent double-paying for the same volume. McKinsey’s research on distributor pricing strategy reinforces this point: gains from rebate programs can be silently eroded when manufacturers give away the same margin on the customer side through uncoordinated discounting, making cap rules and stacking controls essential.
A volume rebate ladder only changes behavior if distributor purchasing teams can see how close they are to the next tier in real time. Providing a simple monthly view of current period volume against the ladder — updated consistently, not just at period close — turns a contractual schedule into an active selling tool for the distributor’s own purchasing managers. Manufacturers evaluating their current ladder design or accrual process can explore Level 6’s channel incentive and rebate solutions or contact our team for a program review.
Frequently Asked Questions
What is a volume rebate tier structure?
A volume rebate tier structure is a schedule of purchase-volume thresholds paired with rebate rates that increase as a distributor buys more during a defined period. Unlike an upfront discount, the rebate is calculated and paid after the period closes, once purchases are verified against the agreed tiers. This protects the manufacturer’s list-price integrity while giving distributors a concrete financial incentive to grow the account.
What is the difference between incremental and retroactive rebate tiers?
Incremental tiers pay each rate only on the units within that specific tier’s range, capping cost predictably at each boundary. Retroactive tiers apply the single highest earned rate to the distributor’s entire qualifying volume once a threshold is crossed. Retroactive structures pay out significantly more for the same purchase quantity, which is why they carry higher and harder-to-forecast liability for the manufacturer.
How many tiers should a distributor rebate ladder have?
Most manufacturers find three to four tiers per distributor segment work best. Fewer tiers make the ladder too blunt to reward meaningful volume differences. More than four tiers creates administrative overhead and is difficult for distributor purchasing teams to track — complexity tends to reduce participation rather than increase it.
How do you set tier thresholds without overpaying?
Thresholds should be set from each distributor’s trailing 12-month purchase baseline, not from top-down sales targets. A practical starting range is 110%–130% of the prior-year baseline for the first tier above baseline. This keeps the ladder achievable, ensures a meaningful cohort of distributors sits just below each boundary at launch, and avoids paying rebates on volume that was never at risk of going elsewhere.
How do you calculate the breakeven point for a volume rebate tier?
Use the formula: incremental units needed = (rebate rate × tier floor) ÷ (gross margin % − rebate rate %). This tells you how much additional volume a distributor must purchase — beyond what they’d buy without the program — before the tier pays for itself in incremental margin. Any tier that fails this test is rewarding existing behavior, not buying new behavior.
Does the Robinson-Patman Act restrict volume rebate structures?
Yes. The act requires that volume rebates be offered on proportionally equal terms to competing distributors at the same functional level of distribution. Published, consistently applied tier ladders generally carry lower legal risk than individually negotiated rates. A rebate is also not considered “available” to a competing distributor who was never informed it existed, so documented communication matters.
How should manufacturers accrue for rebate liabilities under a tiered program?
Rebate liabilities should be estimated and reserved as qualifying purchases occur throughout the period, not when payment is issued. Using the maximum tier rate as a default accrual assumption tends to overstate liability materially. A probability-weighted estimate based on each distributor’s actual purchase trajectory is more accurate and produces smoother period-end financial reporting.
What is the difference between a volume rebate and a growth rebate?
A volume rebate rewards reaching an absolute purchase threshold — a distributor buys 10,000 units and earns the rebate regardless of what they bought last year. A growth rebate sets the threshold as a percentage increase over each distributor’s individual prior-year baseline, specifically rewarding incremental purchases above historical behavior. Growth rebates are more complex to administer but more precisely fund the incremental volume the manufacturer is actually trying to buy.
Final Takeaways
- A working volume rebate tier structure uses three to four tiers per distributor segment, anchored to actual trailing purchase baselines rather than sales-team targets.
- Incremental tier calculation contains manufacturer liability at each boundary; retroactive calculation rewards the distributor more generously but creates larger, harder-to-forecast payouts.
- Run the breakeven formula before finalizing any tier — a tier that only rewards volume the distributor was already going to buy adds cost without adding incentive.
- Tier schedules must be documented, communicated to all competing distributors, and offered on proportionally equal terms to satisfy Robinson-Patman requirements.
- Accrue rebate liabilities using probability-weighted tier estimates updated monthly, and schedule an annual threshold refresh so the ladder stays calibrated as distributor buying patterns shift.
Ready to build or redesign your distributor rebate ladder around real purchase data? Contact our team to walk through a tier structure review with Level 6’s channel incentive specialists.