
Quick Answer: How Do You Calculate SPIFF Program ROI?
Divide incremental gross profit (units above baseline × margin) by total program cost. Track three SPIFF program ROI metrics — incremental sell-through rate, cost-per-unit-moved, and rep participation rate — to confirm the lift is profitable and repeatable.
Why SPIFF Programs Fail the ROI Test
Most SPIFF programs fail the ROI test because their SPIFF program ROI metrics measure total sales instead of incremental sales. When a program reports revenue that would have arrived anyway, the payout becomes a discount rather than an investment.
The scale of that risk is significant. Manufacturers allocate 8 to 11 percent of revenue to trade incentives, and some spend as much as 20 percent, according to McKinsey & Company. For a manufacturer with $500 million in revenue, that is $40 million to $55 million flowing through channel programs each year.
The waste inside that spend is usually structural, not accidental. More than half of channel partners with stagnant or declining sales still receive incentives — payouts that reward the absence of growth, according to McKinsey & Company. That single finding explains why baseline discipline is the foundation of reliable SPIFF program ROI metrics, not an afterthought.
Best-in-class programs look very different. McKinsey reports that leading manufacturers generate 800 units of incremental sales for every 100 units of incentive payout — an 8x volume return. The gap between that benchmark and a typical program is almost never about payout size. It is about measurement.
Programs that cannot separate incremental volume from baseline volume cannot be optimized, defended in a budget review, or scaled. The three SPIFF ROI metrics below fix that in sequence — first proving lift, then pricing that lift, then confirming the behavior driving it is durable. For a primer on how SPIFFs are structured before measurement begins, see our complete guide to SPIFF incentive programs.
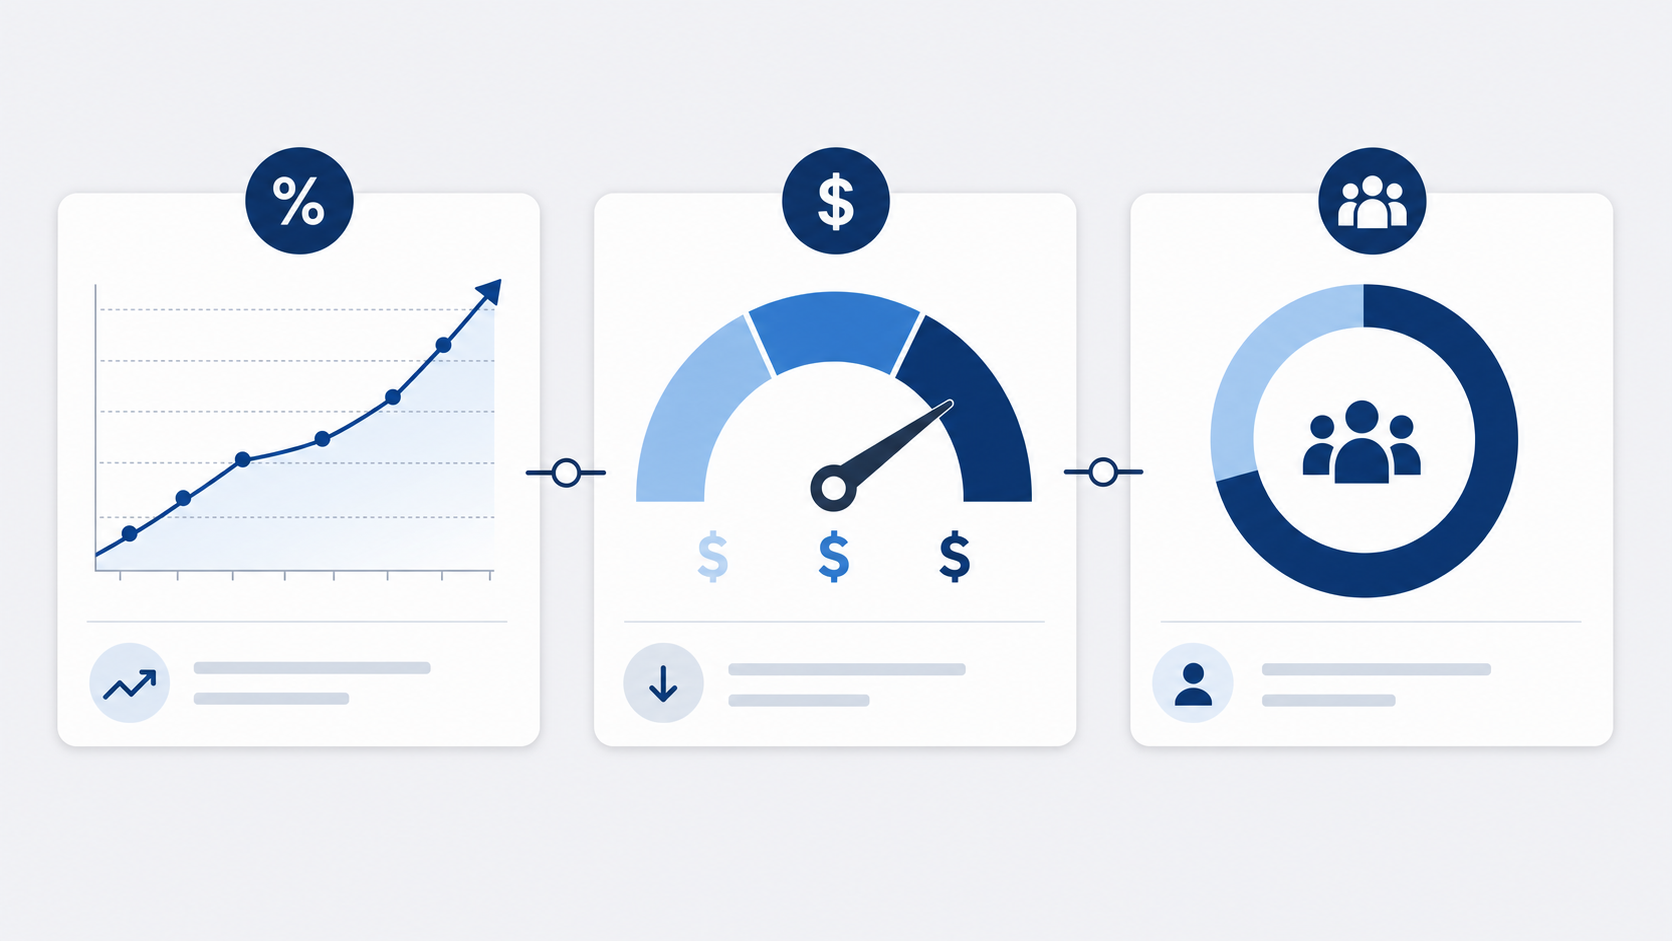
Metric 1 — Incremental Sell-Through Rate
Incremental sell-through rate measures the percentage of units sold above a forecasted baseline during the SPIFF period. It is the single most predictive of all SPIFF program ROI measures because it isolates the volume the incentive actually created.
The formula is straightforward: subtract baseline units from actual units sold, then divide by baseline units and multiply by 100. A dealer network that would have moved 1,000 units and instead moved 1,250 posted a 25 percent incremental sell-through rate.
Incremental sell-through rate = ((actual units − adjusted baseline units) ÷ adjusted baseline units) × 100
How to Set a Defensible Baseline
A defensible baseline is the foundation of credible SPIFF ROI metrics, built before the program launches using trailing 12-month sell-through data adjusted for seasonality and known market shifts. Setting the baseline after results arrive is the fastest way to manufacture ROI that does not exist.
The Incentive Research Foundation applies exactly this methodology, measuring incremental gains above projected plan rather than total revenue. In its nine-month channel sales case study, the program delivered a 32 percent revenue increase against plan — a figure that survives scrutiny precisely because the plan came first.
Lock the baseline in writing with finance before enrollment opens. Two things follow: the ROI calculation becomes auditable, and the sales organization loses the ability to renegotiate the denominator mid-quarter.
For the most defensible SPIFF program measurement, apply a control-group or A-B testing methodology. Assign a matched set of dealers or territories to a non-SPIFF group and compare their sell-through against the incentivized group over the same period. The difference — adjusted for any baseline divergence — isolates what the program actually caused versus what the market delivered on its own.
What Good Looks Like
A healthy SPIFF typically produces 15 to 30 percent incremental sell-through on the targeted SKU during the promotion window. Below 10 percent, the program is usually subsidizing sales that would have closed anyway.
Context matters more than the raw number. A 12 percent lift on a high-margin flagship product can outperform a 40 percent lift on a low-margin accessory, which is why incremental sell-through is never read alone among SPIFF program ROI metrics. Always pair it with margin before drawing conclusions.
Avoiding the Pull-Forward Trap
Sell-in — units shipped to distributors — can rise because a partner loads inventory, while sell-through confirms that products reached end customers. Use end-customer registrations or point-of-sale data whenever possible as the basis for SPIFF sell-through metrics.
Pull-forward is the quieter problem: a strong SPIFF month followed by two weak months means the program moved timing, not volume. Extend the measurement window 60 to 90 days past program close to catch it before reporting final ROI.
Metric 2 — Cost-Per-Unit-Moved
Cost-per-unit-moved is total program cost divided by incremental units sold, and it is the most finance-friendly of the SPIFF program ROI metrics. It converts the lift from Metric 1 into a single number that finance teams can compare directly against gross margin per unit.
Total program cost is where most calculations go wrong. It includes payouts, platform and administration fees, tax and compliance handling, promotional materials, internal labor hours, and fulfillment — not payouts alone. Undercount the denominator and you will overstate every ROI figure the program produces.
Cost-per-unit-moved = total program cost ÷ incremental units moved
A Worked Example
A manufacturer spends $180,000 on a quarterly SPIFF — $150,000 in rep payouts plus $30,000 in administration — and generates 1,200 incremental units. Cost-per-unit-moved is $150. If gross margin per unit is $600, the program returned $4 in gross profit for every $1 spent.
The decision rule is straightforward: cost-per-unit-moved must stay meaningfully below gross margin per unit. A ratio of 4:1 or better is a healthy target for mature programs. When the ratio compresses toward 2:1, the payout structure needs redesign before the next cycle, not more budget.
SPIFF budget as a share of revenue is another guardrail. Most channel programs allocate total SPIFF spend in the range of 0.5 to 2 percent of the targeted product’s expected incremental gross margin, which keeps reward value meaningful without cannibilizing the profit the program is designed to protect. Programs that scale payout above that band typically do so because the denominator — incremental units — is being counted too broadly.
Published benchmarks reinforce that discipline. The Incentive Research Foundation documented $3,934,700 in total incremental improvement against $3,186,900 in total program costs — producing $747,800 in net ROI and lifting net operating income to 19 percent of revenue in a nine-month channel program.
Segment to Expose Hidden Waste
A program-wide average can mask enormous variation. A blended cost-per-unit-moved of $150 might hide one market performing at $60 and another at $280. Segment the SPIFF efficiency metric by dealer, territory, product, and rep tier to identify where payouts are profitable and where they are subsidizing baseline behavior.
Metric 3 — Rep Participation Rate
Rep participation rate is the percentage of eligible sales reps who register a qualifying transaction during the program period. It is the third of the core SPIFF program ROI metrics and the leading indicator — because behavior changes before revenue does.
A healthy program sustains 60 to 70 percent participation among eligible reps who complete a defined qualifying action, not people who only enroll or visit the landing page. Measure what reps do, not what they click.

Why Low Participation Is a Design Problem
We treat sub-40 percent participation as a design failure rather than a motivation failure. The usual causes are payout thresholds set too high, claim processes that take more than two minutes, and reward timing that lands weeks after the sale. Increasing the payout value rarely fixes any of these.
Program mechanics move this number reliably. In one Fortune 500 Tier 1 auto parts program, quarterly contests increased salesperson activity and program website access by nearly 50 percent — a participation gain achieved through cadence and competition, not higher payouts.
Participation as a Shared KPI
Leading manufacturers now hold their own field organization accountable for rep participation. In one automotive OEM program pairing monthly product education with a $20 payout per training video, corporate tracks rep participation as a formal KPI for area sales managers, building SPIFF program accountability metrics into the management layer.
More than half of channel partners with stagnant or declining sales still receive incentives in poorly targeted programs, while best-practice programs direct 97 percent of payouts to growing dealers, according to McKinsey & Company. Participation tracking by dealer growth tier is the mechanism that makes that rep engagement discipline operational.
Putting It All Together — The SPIFF ROI Formula
SPIFF ROI equals incremental gross profit minus total program cost, divided by total program cost, expressed as a percentage. The three SPIFF program ROI metrics feed that equation directly rather than sitting beside it.
Work the SPIFF ROI calculation in four steps:
- Calculate incremental units using the sell-through baseline.
- Multiply incremental units by gross margin per unit to get incremental gross profit.
- Total every program cost — payouts, administration, fulfillment, and internal labor.
- Divide the net gain (incremental gross profit minus total cost) by total cost and multiply by 100.
SPIFF ROI (%) = ((incremental gross profit − total program cost) ÷ total program cost) × 100
Applied to the worked example above: 1,200 incremental units at $600 margin is $720,000 in incremental gross profit. Subtract $180,000 in program cost and divide by that cost, and the program returned 300 percent ROI.
Participation rate then tells you whether that number is repeatable. Two programs can post identical ROI while one drew claims from 65 percent of reps and the other from 18 percent — and only the first will hold up when the promotion ends. McKinsey’s structural guidance reinforces where payouts should sit: anchor 70 to 80 percent of spend to incremental growth above baseline, and route roughly 97 percent to growing dealers as a basic hygiene standard.
Run a sensitivity range alongside the point estimate to show leaders how much the conclusion depends on attribution assumptions.
From the Field — A Regional Automotive OEM’s Three-Year SPIFF Journey
A regional automotive OEM used a sustained SPIFF to shift rep attention toward an overlooked lower-priced model, growing class market share from 28 to 35 percent over three years. The program worked because it leveled the playing field against higher-commission vehicles competing for attention in the same showroom.
Year 1 was deliberately modest: 1,167 incentivized VINs and 28 percent market share in class. That year established the baseline and proved the claim process could handle volume.
Year 2 scaled sharply to 4,220 incentivized VINs and 31 percent share. The lift came from broadening rep eligibility and tightening the gap between sale and reward — which pulled rep participation rate up across the dealer base.
Year 3 reached 5,379 incentivized VINs and 35 percent market share — a 25 percent increase from launch. Because the baseline was fixed in Year 1, every share point after it was measurable against the same reference, and SPIFF program ROI metrics stayed comparable year over year, as documented in Level 6 channel incentive solutions.
The transferable lesson is patience. Multi-year SPIFFs on a single strategic SKU outperform scattered quarterly promotions because reps internalize the product and the habit of selling it compounds.
Warning Signs — When SPIFF ROI Metrics Signal a Redesign
Redesign the program when your channel incentive measurements cross their thresholds: incremental sell-through falls below 10 percent, cost-per-unit-moved approaches gross margin per unit, or participation sits under 40 percent. Any single metric crossing its floor means the structure is failing, not the effort.
- High participation, low incremental lift: Tighten baselines, reward growth tiers rather than volume, or exclude routine sales the program did not create.
- Strong lift, high cost-per-unit-moved: Reduce overpayment through tiered payouts, add caps on high-claimers, or concentrate funds on products with sufficient margin.
- Low participation, attractive unit economics: Simplify enrollment and claims, shorten payout timing, and improve manager communication before changing the reward value.
- Results concentrated in stagnant accounts: Reallocate eligibility toward dealers showing growth potential and confirmed inventory access.
- Sharp post-program drop: Extend the measurement window and restate ROI across the full period — the program moved timing, not demand.
Best practice anchors 70 to 80 percent of trade-incentive payouts to incremental growth above baseline, not to total volume or history, according to McKinsey & Company. Programs that restructure around that principle consistently improve their SPIFF ROI metric scores within two program cycles.
Final Takeaways
- Measure incremental sell-through against a baseline locked in writing before launch — total revenue is not a SPIFF ROI metric.
- Calculate cost-per-unit-moved on all-in program cost divided by incremental units, and target a 4:1 ratio to gross margin per unit or better.
- Target 60 to 70 percent qualified rep participation; below 40 percent is a design problem, not a motivation problem.
- Anchor 70 to 80 percent of payouts to growth above baseline so spend follows incremental performance rather than history.
- Review all three SPIFF program ROI metrics together each cycle, and extend measurement 60 to 90 days past close to catch pull-forward effects.
Build a SPIFF Program You Can Measure
We design and administer channel incentive programs that report incremental lift, cost-per-unit-moved, and participation from day one. If you want a program your finance team will defend, contact our team to review your current SPIFF program ROI metrics and baseline methodology.
Frequently Asked Questions About SPIFF Program ROI Metrics
How do you measure SPIFF program success?
Measure SPIFF success with three metrics rather than one: incremental sell-through rate above a pre-set baseline, cost-per-unit-moved against gross margin per unit, and rep participation rate. Total revenue during the program period is not a success measure because it includes sales that would have happened without the incentive. Reviewing all three together shows whether results are both profitable and repeatable.
What is a good ROI for a SPIFF program?
A strong SPIFF program returns at least $4 in incremental gross profit for every $1 of all-in program cost. For volume-based comparison, McKinsey reports best-in-class manufacturers generate 800 units of incremental sales per 100 units of incentive payout. The Incentive Research Foundation documented $747,800 in net ROI on $3,186,900 in program costs in a nine-month channel program.
What is incremental sell-through rate?
Incremental sell-through rate is the percentage of units sold to end customers above a forecasted baseline during the incentive period. Calculate it by subtracting baseline units from actual units, then dividing by baseline units and multiplying by 100. A healthy SPIFF typically produces 15 to 30 percent incremental sell-through. Use sell-through data rather than sell-in, since distributor shipments do not confirm end-customer demand.
How is cost-per-unit-moved calculated?
Cost-per-unit-moved equals total program cost divided by incremental units sold above baseline. Total program cost includes rep payouts, platform and administration fees, tax and compliance handling, promotional materials, and internal labor. A program spending $180,000 to generate 1,200 incremental units has a cost-per-unit-moved of $150. Compare that figure directly against gross margin per unit to judge profitability.
What participation rate should a SPIFF program target?
Target 60 to 70 percent of eligible reps registering at least one qualifying transaction during the program period. Participation below 40 percent usually signals design problems — thresholds set too high, claim processes that take too long, or rewards paid weeks after the sale. Some manufacturers now track rep participation as a formal KPI for their area sales managers.
How long should a SPIFF program run?
Most SPIFF programs run 30 to 90 days to create urgency, but strategic product pushes perform better sustained over multiple years. A regional automotive OEM grew class market share from 28 to 35 percent across three years of sustained SPIFF activity on a single overlooked model. Extend measurement 60 to 90 days past close to confirm the program created demand rather than shifting timing.
What is the difference between a SPIFF and a rebate?
A SPIFF pays an individual salesperson directly for selling a specific product, while a rebate pays the partner company based on volume or revenue thresholds. SPIFFs change rep behavior at the point of sale and pay quickly in small amounts. Rebates influence partner purchasing and inventory decisions, settle over quarters, and require different compliance and accounting treatment.
When should you run a SPIFF versus a longer-term incentive?
Run a SPIFF when you need fast attention on a specific SKU — a new launch, an overlooked model, or aging inventory. Choose a longer-term incentive when the goal is partner loyalty, category growth, or sustained share gains. McKinsey advises anchoring 70 to 80 percent of payouts to incremental growth above baseline regardless of which structure you select.