
Quick Answer: What Is a Good Consumer Rebate Redemption Rate?
A good consumer rebate redemption rate depends on offer type and face value: low-value mail-in rebates historically redeem near 30%, while digital and instant offers commonly reach 50% or more. Maximize legitimate redemptions while keeping payout liability predictable, rather than chasing one universal number.
Why Redemption Rate Is the Most Important Metric in Your Rebate Program
The consumer rebate redemption rate is the single number that tells you whether your offer actually changed buying behavior or merely funded customers who would have purchased anyway. It is the share of eligible buyers who successfully claim and receive the rebate, and it directly governs both program ROI and your true cost per incremental sale.
We treat redemption rate as the program’s vital sign. A high rate signals an offer that was visible, easy to claim, and valued; a low rate signals friction, weak communication, or an offer consumers never intended to complete.
The economics are unforgiving. McKinsey research on consumer-packaged-goods trade promotions found that roughly 59% lose money globally—and as many as 72% in the United States—largely because spend never converts into incremental demand (McKinsey & Company). When you cannot predict your rebate redemption rate, you cannot predict whether you are in the profitable minority.
A historical comfort has quietly distorted the industry. For years, manufacturers leaned on “breakage”—rebates that go unredeemed—as a margin cushion, and reporting on mail-in rebates noted that an estimated 40% to 60% were never redeemed (The New York Times, summarizing Nielsen-tracked rebate data). Designing for breakage is a strategic mistake: it trains customers to distrust your offers and leaves incremental sales on the table.
Redemption rate matters more than offer size, impressions, or submission counts, because it is the only figure that combines reach, design quality, and follow-through into one honest measure of whether the program worked. For a broader view of how the metric fits into program economics, see our analysis of the pros and cons of rebate programs.
Consumer Rebate Redemption Rate Benchmarks by Offer Type
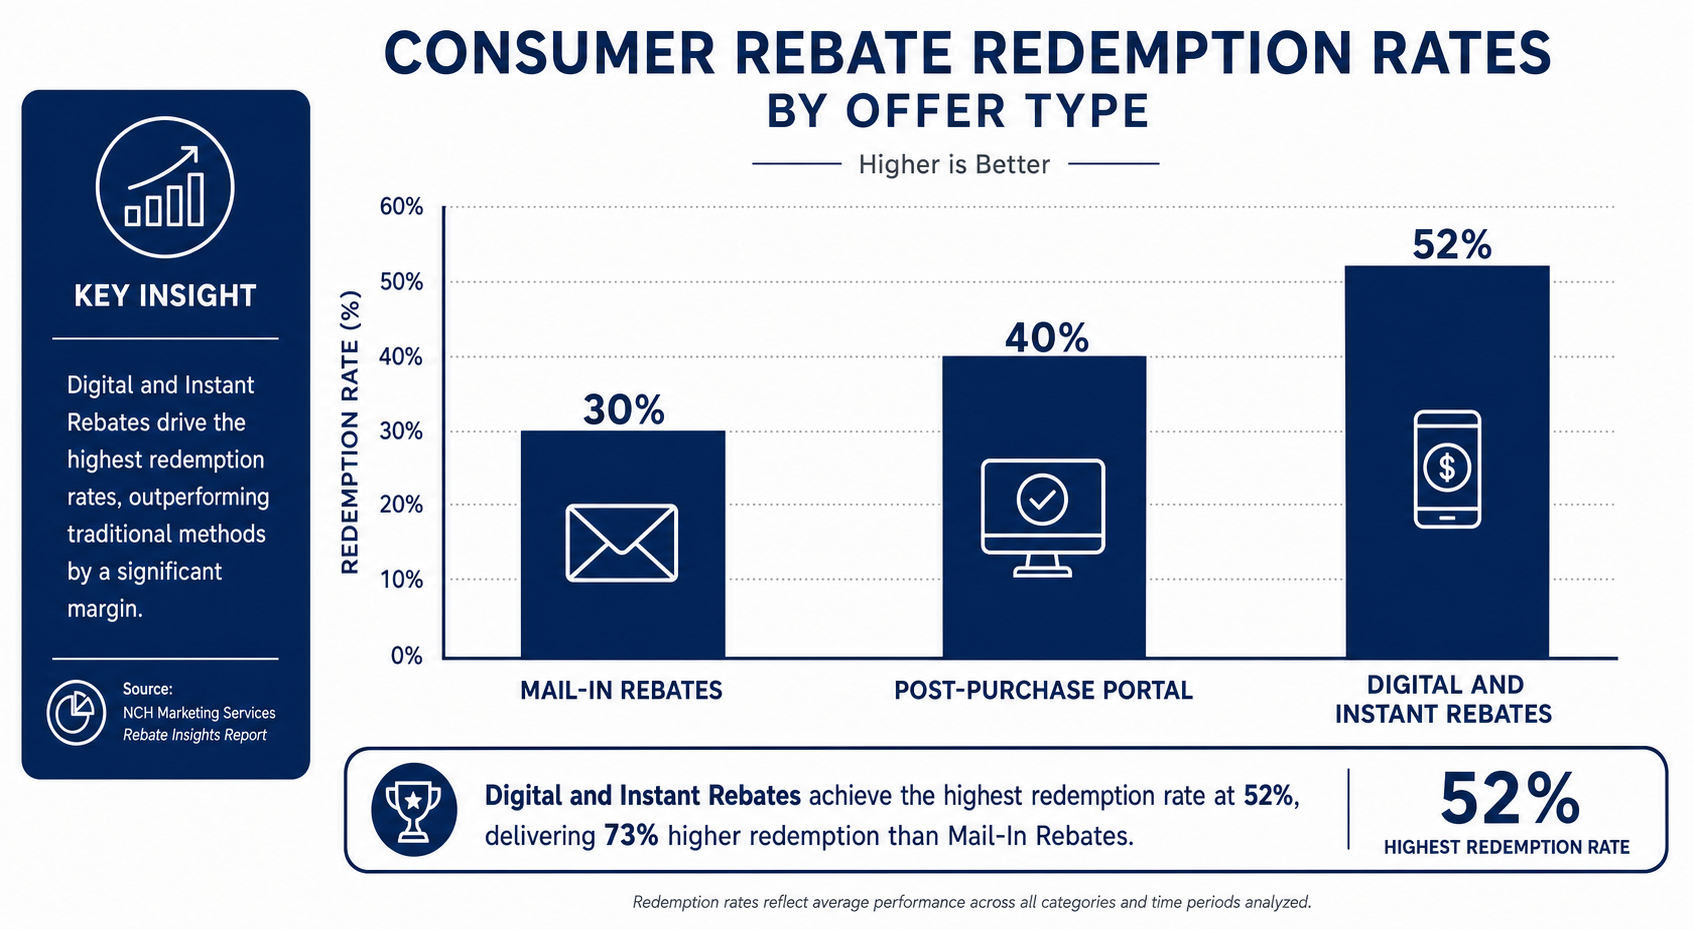
There is no universal benchmark; the right consumer rebate redemption rate varies dramatically by claim mechanic, from roughly 30% for low-value mail-in offers to well above 50% for frictionless digital and instant formats. Below we break down realistic ranges by offer type so you can benchmark against the right comparison set rather than an industry-wide average.
Mail-in Rebates
Mail-in rebates carry the lowest redemption rates because they impose the most friction. The long-standing planning benchmark for low-value mail-in offers has been roughly 30% redemption, with the remainder lost to breakage.
That breakage is enormous: an estimated 40% to 60% of mail-in rebates historically went unredeemed (The New York Times). Much of this is structural—mail-in claims involve forms, original receipts, UPC codes, postage, and a wait that averaged around 60 days. Each step is an opportunity to abandon, and the delay suppresses the rebate redemption rate by separating effort from reward.
The behavioral research is blunt about why. Harvard Business School work by Gourville and Soman shows that consumers systematically overestimate their own likelihood of redeeming at purchase, then fail to follow through (Harvard Business School).
Digital and Instant Rebates
Digital and instant formats post the strongest consumer rebate redemption rates because they collapse the gap between purchase and payout. Instant rebates applied at checkout approach the purchase itself, while digital post-purchase claims remove postage, paper, and most of the wait.
In contemporary CPG practice, digital redemption now averages roughly 52%, drawn from analysis of 133 campaigns using 2024 data—a step-change from the mail-in era that reflects how much historical breakage was caused by mechanics, not consumer indifference.
The pattern mirrors what happened in couponing. Marketing Dive, reporting NCH Marketing Services data, noted that traditional free-standing-insert (FSI) coupons redeem at only about 1.2%, while digital coupons redeem in the 10% to 20% range—an order-of-magnitude difference driven almost entirely by convenience (Marketing Dive). Consumer preference reinforces the shift: roughly 74% of consumers now prefer digital payment methods over a mailed check, so a digital rebate benefits from both lower effort and a more desirable reward delivery.
Post-Purchase Portal Rebates
Post-purchase portal rebates—where consumers submit a claim through a branded online portal after buying—sit between mail-in and instant formats, with redemption heavily dependent on portal design and payout speed. A well-built portal with photo-receipt upload and digital payout can rival instant rebates; a clumsy one can sink back toward mail-in levels.
The decisive variables are claim simplicity and time-to-cash. The U.S. Federal Trade Commission’s Mail, Internet, or Telephone Order Merchandise Rule requires sellers to fulfill within the promised window or within 30 days when none is stated, and to refund promptly when they cannot (Federal Trade Commission). Best-in-class portal programs pay far faster, and that speed lifts the consumer rebate redemption rate by reinforcing trust. We walk through the mechanics in our guide to how the rebate process works.
Five Levers That Consistently Lift Redemption Without Inflating Payout Liability
The most reliable way to raise your consumer rebate redemption rate is to remove friction and sharpen communication—not to raise the offer amount. These five levers improve legitimate redemption while keeping payout liability forecastable, so you grow incremental sales rather than waste.

1. Reduce Claim Friction: Digital Over Mail
Friction is the largest single suppressor of redemption, so the highest-leverage move is shifting from mail-in to digital claims. Every eliminated step—postage, photocopying, mailing originals—recovers redemptions that were lost to logistics rather than intent.
The behavioral economics quantifies the hidden tax of friction. Research by Rodemeier finds that consumers underestimate the hassle of rebate redemption by a meaningful margin—on the order of €20 per consumer—so they buy expecting to redeem and then don’t (American Economic Journal: Economic Policy). Removing friction closes that gap, lifting the rebate redemption rate without changing the offer.
2. Calibrate Face Value to the Behavior You Want
Redemption rate rises predictably with face value, so calibrating the dollar amount lets you buy exactly the response you need. Larger rewards justify the effort consumers must spend to claim them, which is why high-value rebates redeem at far higher rates than small ones.
The observed pattern is steep: sub-$20 offers redeem around 38%, $50 offers near 50%, $100 offers around 60%, and $200 offers as high as 80%. A small rebate on a high-volume SKU may look cheap per unit but deliver weak incremental lift, while a calibrated higher-value offer can both raise the consumer rebate redemption rate and improve ROI. We model these trade-offs in our work on consumer rebate program design.
3. Communicate the Claim Window: Urgency Without Confusion
A clearly communicated claim window lifts redemption by creating urgency, but only when it is simple enough not to confuse. Ambiguous deadlines and buried terms are a leading cause of abandonment.
The abandonment data is instructive: surveys of rebate behavior attribute roughly 41% of non-redemption to simply forgetting, 25% to losing the required paperwork, and 14% to giving up because the process was too complex. A well-timed reminder cadence and a single, unambiguous deadline directly counter the largest of these failure modes and raise the rebate redemption rate—a direct application of the present-bias and overconfidence dynamics documented in the Harvard Business School rebate research.
4. Maximize Point-of-Sale and Digital Visibility
Consumers cannot redeem an offer they never noticed, so visibility at the point of sale and across digital touchpoints is a foundational lever. Strong on-pack, on-shelf, and online-checkout placement raises the share of buyers who enter the claim funnel at all.
Visibility also protects against the trade-promotion waste McKinsey documented, because spend tied to a visible, claimable offer is more likely to generate incremental rather than subsidized sales (McKinsey & Company). Meeting consumers in the channel they already use multiplies the redemption rate (Marketing Dive).
5. Simplify Proof of Purchase—Balanced Against Fraud Controls
Simplifying proof requirements lifts redemption, but it must be balanced against fraud exposure so you do not trade breakage for leakage. Photo-receipt upload and automated validation can keep claims easy while still screening for abuse.
The goal is the minimum proof that protects the program. Asking for original UPCs, mailed receipts, and serial numbers depresses the rebate redemption rate among honest buyers far more than it deters fraudsters, so over-engineering proof is usually a net loss. We cover how to strike that balance in our analysis of fraud risks in channel incentive programs.
How to Calculate and Forecast Your Redemption Rate
Drawing on 25+ years of rebate program design at Level 6, we calculate the consumer rebate redemption rate as valid, paid rebate claims divided by eligible qualifying purchases, expressed as a percentage. Forecasting it means applying that ratio—segmented by offer type and face value—to projected sales before you commit budget.
Redemption rate = (Valid paid claims ÷ Eligible qualifying purchases) × 100
The discipline is in choosing the right denominator and benchmark. Forecast each offer against its own comparison set—mail-in against ~30%, digital against ~52%, and face value against the sub-$20 (~38%), $50 (~50%), $100 (~60%), and $200 (~80%) curve—rather than a blended average that hides the variance. This is what lets you predict payout liability accurately enough to stay out of the loss-making majority of promotions McKinsey identified (McKinsey & Company).
We also recommend a sensitivity band rather than a single point estimate. Because consumers overestimate their likelihood of redeeming, early submission velocity can mislead; model a high and low scenario, fund to the high case, and reconcile as real claims arrive. Tracking is itself a known weak spot—older industry research found only 57% of programs could reliably track submission, issuance, and rebate redemption rates (Chief Marketer, reporting Aberdeen Group research), so instrument your measurement before you launch. Our rebate program solutions provide real-time dashboards for all four funnel stages.
KPIs to Track Alongside Redemption Rate
The rebate redemption rate is your headline metric, but four supporting KPIs reveal where the funnel leaks and what to fix first:
- Cost per claim: total payout liability divided by approved claims—your true per-unit cost of incremental volume.
- Approval/rejection rate: claims approved as a share of claims submitted; a high rejection rate signals over-engineered proof requirements or fraud controls that catch too many legitimate buyers.
- Time-to-payout: the average calendar days from claim submission to payment; every extra day raises abandonment in future programs.
- Incremental lift: the sales increase attributable to the offer versus a control period or matched market—the figure that ties the rebate redemption rate to actual ROI rather than just program activity.
Testing and Optimizing Over Time
The programs that consistently outperform benchmarks treat the consumer rebate redemption rate as an iterative target, not a fixed outcome. A/B testing single variables—claim window length, payout delivery method, reminder cadence—against a control cohort isolates what actually moves the needle. Run parallel offer structures on matched audience segments, measure the delta in redemption rate and cost per claim, and carry the winning configuration into the next program cycle. This iterative review discipline is built into how we design rebate and incentive programs for manufacturers.
What a Low Redemption Rate Is Really Telling You
A low consumer rebate redemption rate is rarely a sign that consumers don’t want the reward—it is usually a diagnosis of friction, poor visibility, or slow payout. Read it as feedback on your program design, not as inevitable breakage to be banked.
Start by separating intent from execution. The behavioral evidence is consistent: consumers intend to redeem and overestimate that they will, so a gap between submissions and qualifying sales points to mechanics, not motivation (Harvard Business School). When buyers underestimate hassle by roughly €20 and then abandon, the fix is to remove the hassle, not to accept the loss (American Economic Journal: Economic Policy).
Consider an anonymized example applying Level 6’s four-stage funnel diagnostic. One consumer electronics manufacturer running a sub-$20 mail-in offer saw a consumer rebate redemption rate stall near 29%—roughly in line with the historic mail-in floor. Abandonment surveys pinpointed the familiar culprits: 41% forgetting and 25% losing required paperwork. The program shifted to a digital portal with photo-receipt upload and an ACH payout SLA of 7 business days. Within two promotion cycles (approximately six months), the rebate redemption rate climbed to 49%—a 20-percentage-point lift—with no increase in face value or program budget.
How to Read the Four-Stage Claim Funnel
The fastest way to turn a low consumer rebate redemption rate into an action plan is to break the program into a four-stage funnel and find the stage that leaks. Each stage isolates a different failure—awareness, friction, validation, or fulfillment—so you fix the real cause instead of guessing.
- Eligible purchases → claims started: if buyers never begin, the offer lacks visibility or perceived value.
- Claims started → claims submitted: if buyers start but do not finish, the claim flow has too much friction.
- Claims submitted → claims approved: if submissions are healthy but approvals are weak, proof rules or validation logic are too aggressive.
- Claims approved → claims paid: if approvals are healthy but payment lags, the issue is fulfillment and trust, not demand.
A worked example shows the diagnostic in action. Suppose a manufacturer sells 100,000 eligible units, receives 42,000 submitted claims, approves 38,000, and pays 37,000; the consumer rebate redemption rate is 37% on eligible purchases, while the approval rate is about 88% on submitted claims. The healthy approval-to-paid step tells you the problem lives upstream—at awareness and submission—so the levers to pull are visibility and friction.
Treating breakage as profit is the deeper trap. A low rebate redemption rate driven by friction signals that your offer drove sales you are now failing to honor in spirit, which erodes brand trust and depresses response to future promotions. The healthier interpretation is that a redemption shortfall is the most actionable signal in your program—and almost always fixable through the five levers above.
Frequently Asked Questions
What is a good consumer rebate redemption rate?
It depends on offer type and face value. Low-value mail-in rebates historically redeem near 30%, while digital CPG offers now average around 52%; the right benchmark for your rebate redemption rate is the comparison set for your specific mechanic and face value, not a blended industry average. High-value offers ($100+) can reach 60–80%, so always segment before forecasting payout liability.
Why do so many mail-in rebates go unredeemed?
Mail-in rebates impose high friction—forms, original receipts, postage, and long waits—and an estimated 40% to 60% historically went unredeemed (The New York Times). Consumers also overestimate their likelihood of completing the claim at the point of purchase, so intent rarely converts to follow-through. That gap between stated intent and actual redemption is structural, not motivational.
How does face value affect the rebate redemption rate?
Redemption rises predictably with reward size. Sub-$20 offers redeem around 38%, $50 offers near 50%, $100 offers around 60%, and $200 offers as high as 80%, because larger rewards justify the effort consumers must spend to claim them. This curve means a modestly higher face value can meaningfully lift your consumer rebate redemption rate while improving incremental ROI—not just payout cost.
Are digital rebates really better than mail-in?
Yes, on both redemption and preference. Digital CPG offers average roughly 52% redemption, and about 74% of consumers prefer digital payment over a mailed check—mirroring couponing, where digital redeems at 10–20% versus about 1.2% for FSI coupons (Marketing Dive).
How fast do we legally have to pay a rebate?
The FTC’s Mail, Internet, or Telephone Order Merchandise Rule requires fulfillment within the promised time or within 30 days if none is stated, with prompt refunds when you cannot deliver (Federal Trade Commission). Best-in-class programs pay far faster—often within 7 to 10 business days.
How should we calculate our rebate redemption rate?
Divide valid, paid claims by eligible qualifying purchases and multiply by 100. Segment the calculation by offer type and face value so your forecast reflects real variance rather than a misleading company-wide average. Drawing on 25+ years of rebate program design, we recommend building a high/low scenario band—fund to the high case and reconcile as actual claims arrive, since early velocity can mislead due to consumer overconfidence at purchase.
Is high breakage actually profitable for our brand?
Rarely in the long run. A low consumer rebate redemption rate driven by friction means you drove sales on a promise you failed to honor, which erodes brand trust and suppresses response to future offers. Most CPG trade promotions already lose money (McKinsey & Company), and relying on breakage accelerates that outcome by training consumers to ignore your offers entirely.
Can a rebate redemption rate be too high?
In theory, yes—if your consumer rebate redemption rate far exceeds your high-case scenario, it can signal the offer attracted existing buyers rather than incremental ones, or that fraud controls are insufficient. In practice, most programs are far more at risk from a rate that is too low than too high. A rate above your modeled high case warrants a fraud audit and incrementality analysis, not a reduction in claim convenience.
Rebate vs. Discount: Which Protects Margin Better?
Manufacturers often face a binary choice: offer an upfront discount or run a deferred rebate. The right answer depends on whether you want to guarantee margin or trade some payout certainty for a behavioral hurdle. Rebates protect margin precisely because not all buyers redeem; a discount, by contrast, immediately reduces revenue on every eligible unit sold regardless of whether the buyer needed the incentive to purchase.
When Rebates Win
A deferred rebate is the better choice when three conditions hold: the product is a considered purchase, the offer face value is high enough to justify claiming effort, and you need to isolate incremental buyers from those who would have purchased anyway. The behavioral research confirms this math—consumers systematically overestimate their likelihood of claiming, which means the effective discount for the brand is lower than the stated face value (Harvard Business School).
Segmentation: How Redemption Rate Varies by Channel and Audience
A single program-wide rebate redemption rate can mask wide variance across channels and audiences. Club-store buyers redeem at higher rates than mass-merchandise buyers because their purchase is more deliberate; online buyers redeem at higher rates than in-store buyers because digital submission is already their default. Effective program design segments the redemption forecast by retailer, channel, and audience cohort rather than blending them into one number, then tailors payout delivery method and reminder cadence by segment. A buyer in a digital-first channel who prefers ACH needs a different communication flow than a brick-and-mortar buyer who expects a mailed check.
First-Party Data and Retention Value After Redemption
Every rebate claim is a data-capture event. A consumer submitting a digital claim provides product ownership, purchase channel, payer information, and contact permissions—first-party data that is increasingly valuable in a cookieless environment. That data belongs in the ROI analysis: a program with a 52% rebate redemption rate and a strong post-claim CRM enrollment rate is worth more than its payout cost suggests. Brands that treat redemption as the end of the transaction leave the downstream remarketing and loyalty enrollment value—often worth more than the cost of the rebate itself—entirely on the table.
Final Takeaways
The consumer rebate redemption rate is the truest measure of whether your program changed behavior, and it is almost entirely within your control. The historic 30% mail-in benchmark and the 40–60% breakage it implied are artifacts of friction-heavy mechanics, not a law of consumer behavior (The New York Times).
The path to a higher rebate redemption rate is consistent: move to digital, calibrate face value to the response you need, communicate one clear claim window, maximize visibility, and simplify proof while controlling fraud. Each lever recovers redemptions lost to logistics rather than intent—exactly the gap the behavioral research identifies (American Economic Journal: Economic Policy).
Most importantly, stop treating breakage as profit. With digital CPG rebate redemption rates now averaging around 52% and best-in-class programs paying in 7 to 10 business days, the brands that win make redemption easy and honor it fast—turning the consumer rebate redemption rate from a liability to be managed into a competitive advantage to be grown.
Ready to lift your redemption rate without inflating payout liability? Contact our team to design a rebate program built for fast, frictionless redemption.