
I’ve noticed that projects like to grow when we put time into them, a bit like how plants usually bloom when they’re watered right. Business intelligence tools are genuinely great in this way because they definitely make our work easier, particularly when it comes to managing a lot of data.
At first, adding big data to my work was really overwhelming, kind of like trying to drink from a fire hose. But business intelligence tools are specifically made to handle this and are super important for our work.
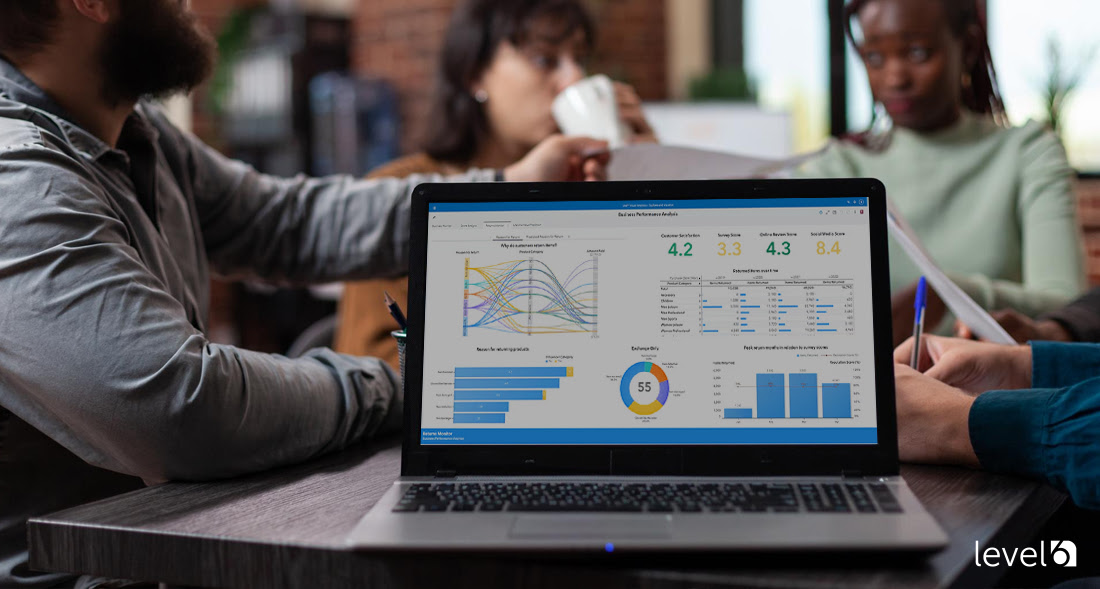
Now, let’s go ahead and talk a bit more about why Business Intelligence tools are so important!
What Are the Parts of BI Tools?
Let’s talk about how these tools turn raw data into useful plans through these three very important stages: data preparation, discovery, and visualization.
I have really come to appreciate the data preparation stage. This stage means cleaning, organizing, and integrating data from all sorts of different sources. It’s kind of like making a strong, solid foundation before you even start building a house. Making absolutely sure that your data is accurate and the latest can really affect the entire analysis process.
After you have finished making your data ready comes the discovery phase. This stage uses some advanced data mining methods to find some really interesting patterns and connections in the data. It’s pretty exciting – kind of like putting together a challenge where each piece shows new plans and opportunities that were previously hidden.
I particularly enjoy the visualization stage for myself. This part means actually turning complicated data sets into easy, visual formats that almost anyone can really understand. Interactive dashboards and reports are particularly helpful here, as they let you have quick access to data during meetings and show important metrics immediately.

It’s also pretty important to remember the role of regular reports, if they’re standard or customized. These reports are very important for keeping everyone in sync about all sorts of business metrics. They help to watch progress and also support very in sync decisions that move the organization’s overall goals forward.
Analytics are really important throughout these stages. They help us to understand past events, look into why those events happened, predict future patterns, and they give you valuable advice. Analytical methods are really important for finding patterns and protecting your business from potential risks while improving overall outcomes.
Based on my own experience and seeing the important benefits for myself, I strongly recommend that anyone looking to make more informed business decisions start with BI tools. They are seriously useful in the long run.
Microsoft Power BI Features
You might be asking if Power BI fits well with your team, particularly if you already use Microsoft products. Based on my experience, I strongly recommend adding Power BI to your toolkit. It works really well with well-known applications like Excel and the entire Office suite. This combination honestly saves time and makes learning easy, really boosting your team’s productivity right from the start.
Now, let’s take a little look at how Power BI actually works with data. Back in the past, honestly, I really struggled with managing those large spreadsheets. Luckily enough, Power BI makes data management a bit easier through a feature that is known as Power Query. This particular tool is particularly helpful when you happen to be working with just some easy Excel files or maybe some difficult database extracts. For people who really like to totally avoid coding, Power Query really cuts down on this necessity by automating really boring tasks.

You might find it’s easier to organize data in Power BI than you might first think. You have the chance to sort your data by all sorts of themes, change settings, and get all your important details in one place. Keeping an organized dataset is pretty important for meeting data governance standards, which, as you might expect, helps ensure compliance and really increases operational efficiency.
Then, think about an example of an energy company that used Power BI to analyze its trading data. The helpful plans they derived were very important for improving their resource management and pricing plans. Also, Power BI’s AI features, like image recognition, are really great for looking at more complicated, unstructured data.
The strong integration with Azure Machine Learning and the soon-to-be-released Copilot feature is great for predicting patterns and fitting tasks that best match your growing data plans.
From what I’ve seen, Power BI also improves team collaboration. It updates information in real time, which makes sure that everyone is in sync and can share their ideas pretty easily. This feature is particularly helpful for avoiding data silos and definitely makes the decisions process much smoother.
Customizing features in Power BI is fairly easy. It lets developers change visualizations and integrate APIs from other software with a good amount of flexibility. This flexibility proves helpful for all kinds of teams.
Visualization Strengths of Tableau
Tableau really makes it easier for us to manage difficult data and makes the process seem very easy. I easily remember my first experience with Tableau; honestly, it was as if everything suddenly became crystal clear. After that, my data dashboards started to look much clearer.
I am really pretty impressed with Tableau’s ability to skillfully handle real-time data analytics. In any situation where fast decisions are pretty important, having access to the latest data helps us consistently avoid the problems associated with old information. Tableau’s ability to easily work with all sorts of data sources, like MS Excel, Google Analytics, and Salesforce, really sets it apart from other platforms.

From my work with different companies, I have noticed that Tableau consistently turns difficult data into lovely visual stories that are easy for nearly anyone to understand. This clear presentation is very important for making in-sync decisions. Just imagine, To give you an example, a retail chain that tracks sales across different regions and all sorts of product lines – Tableau is remarkably quick to point to upcoming patterns and big opportunities. For marketers, the ability to visually break down customer data and look into campaign results can really change the game, leading to quick adjustments to plans on the fly.
A feature I find very useful in Tableau is “Explain Data.” It automatically checks for outliers and patterns, which saves a huge amount of time when we’re making reports or changing plans. Whether it’s Tableau Desktop for individual projects or Tableau Online or Server for bigger jobs, it is great in any setting.
Tableau also promotes a team-oriented technique to data management by making the sharing of plans via emails or direct links much easier. This feature definitely helps create smoother conversations and very useful problem-solving, keeping everyone in sync and really improving workflow efficiency in teams. Everything operates more smoothly when everyone is involved and collaborates easily.
SAS Viya’s Advanced Analytics
SAS Viya’s Advanced Analytics is really affecting the business intelligence sector with its tough AI-driven tools optimized for cloud environments. Based on my experience, I think SAS Viya is a big change in handling difficult data analyses. It proves to be basically helpful for advanced modeling and predictive analytics, both of which are important for boosting your analytical capabilities.
I particularly appreciate the model management feature. It lets you create models quickly and keep them easily. I have noticed that model management is usually a difficult area to learn about in analytics, so this feature really stands out as a great benefit.
The platform improves each stage of the analytics lifecycle and makes decisions easier across your organization. This gives a big benefit.
Also, SAS Viya adjusts as your business and data needs evolve. This flexibility is important for staying competitive in fast-moving industries.
Also, SAS Viya is budget-friendly. It was built to cut your cloud operational costs, which is important for any company looking to spend less on BI technology. The potential to lower cloud operating costs by up to 86% makes it even more valuable in tough economic climates.
SAS Visual Analytics further includes impressive interactive data visualization tools. These tools have drastically improved problem-solving for many of my clients. Helpful visualization clearly affects outcomes really well.
Here is a basic example: I helped a large retail chain help with its overall supply chain efficiency and customer happiness, SAS Viya. Well, the chain got much better plans for consumer habits, which really proved to be useful. Believe it or not, these improvements ended up leading to much smoother operations and increased sales. So, if you want to help with your business with better analytics capabilities, SAS Viya might be the perfect answer. It has shown some excellent results for many and could really help your business as well.
QlikSense’s Self-Service Analytics
So, you’ve probably heard me talk pretty a bit about QlikSense, particularly since I work with a lot of data, just like you might. It has really changed how businesses handle difficult information. One of the great features of QlikSense is actually its analytics engine. Unlike traditional BI tools that limit you to predefined queries, QlikSense lets us have the freedom to look at data connections pretty freely. It’s seriously helpful because it really helps us find those difficult patterns and relationships that traditional methods usually miss.
Now, I want to talk a little bit about the smart visualization features – these ones are actually my favorite. As someone who makes data-based decisions every day without actually being an expert in data, I find these tools extremely helpful. They make difficult data into clear, practical plans with dashboards that are easy to use, pretty advanced, and always updated. This lets me access real-time analytics without actually getting overwhelmed by spreadsheets.
Working with my team is easy with QlikSense, if we are together in one place or spread around the world. The platform’s collaborative space and strategic tools are very useful. They let us look at the same data points, help with our decisions, and cut down on the number of endless emails.

It’s really no surprise that QlikSense is popular across all kinds of departments. Which showed pros use it to help with their customer campaigns, while finance officers find it perfect for looking at cost metrics. Its flexibility is definitely impressive. But, what really impresses me is its adaptability. It works with everything from easy visual summaries to full analyses for powerful evaluations.
Also, the inclusion of AI and machine learning is actually very helpful. As our data grows, these features help our plans stay sharp and efficient. For newcomers, AI-driven guided analytics are excellent for getting to know our data and starting new projects based on those plans.
Honestly, QlikSense has turned our job of data management from a needed utility to an interesting and active exploration. It has made my workload much easier to manage, and I would definitely recommend it to any team that finds their data plans important.
Real-Time Plans on Domo
Domo is currently making a big change in the business intelligence area, you see. It acts as a pretty flexible tool for managing data and connects with everything from social media to all sorts of databases and many cloud services. For a business just like ours, Domo actually completely changes how we manage data. It brings together different data streams into a single, organized, and easy-to-understand format, which definitely makes our processes somewhat easier.
I have really become a big fan of Domo’s real-time data visualization capabilities. In our industry, it’s really important to make quick decisions, and Domo gives us clear and updated information. This being clear really helps us to take advantage of opportunities as soon as they come up, really changing how we work.

Now, then, I want to talk for a moment about Domo’s scalability, which is a big benefit, honestly. Domo fits both when you’re starting a new business and while running a bigger, established company. It easily manages growing amounts of data and increasingly complicated visualizations.
I must also talk, if I may, about its easy-to-use interface. You don’t need to be a tech expert or have a large IT budget to use it, which is very helpful when our resources are kind of limited.
Think about this for a second: companies of all sizes, from large retail chains to upcoming tech startups, really trust Domo to simplify their operations and really speed up their data decisions processes. To give you just one example, a retail company that tracks real-time sales data across different regions might quickly find underperforming products or see upcoming consumer patterns that need immediate attention. This kind of agility really points to the important part that tools like Domo play in today’s very competitive market.
How Can BI Tools Help Your Business?
The more I learn, the more convinced I become of the ability of these tools to really change our data management practices. Each tool is great at managing large datasets, finding upcoming patterns, and making strategic decisions easier. It’s kind of exciting to really think about how they could possibly change our way of scheduling data, right?
Just imagine adding a simple BI system into our everyday workflow. It could really help with our performance during strategy meetings by giving solutions that are customized to our specific business challenges and goals. Why not take this opportunity to turn difficult data into a unique asset that could help us grow faster and work more easily? Do you think your business could really use these advanced tools to get a competitive edge?

Here at Level 6, we focus on improving your business strategy with custom incentive programs that work really well with these BI tools. Our dedicated team is committed to keeping alignment and really boosting productivity and morale. Why not contact us for a completely free demo and see how we can help your business with the power of BI tools? Let’s work together and push your company to the forefront.